What do the statistics tell us about who will be voting this year?
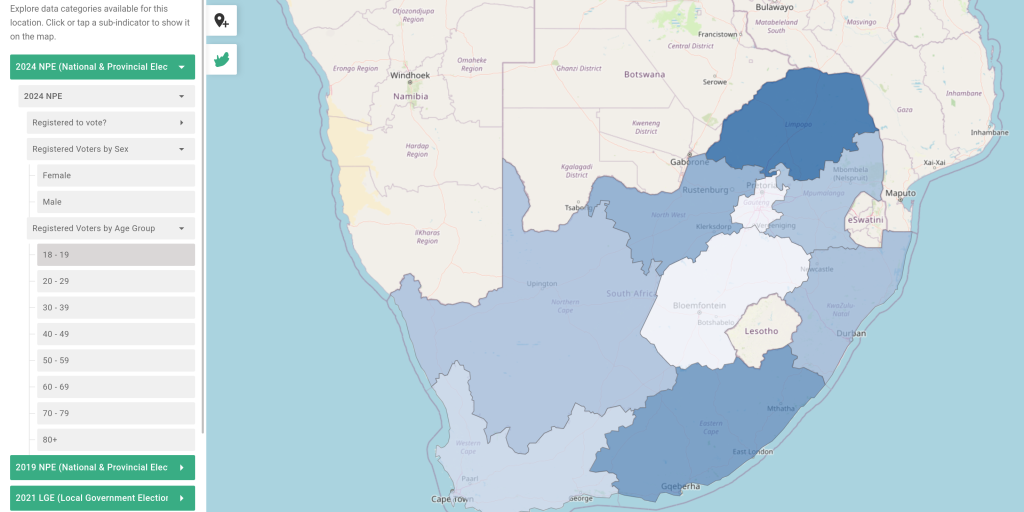
The SANEF Elections Dashboard has been updated with comprehensive voter registration data, and a breakdown of demographic statistics by gender and age for all municipalities in the country. This data is taken from the IEC’s election portal and is not available at the voting district level. There is also no information relating to voter demography by ethnic group or home language at this point.
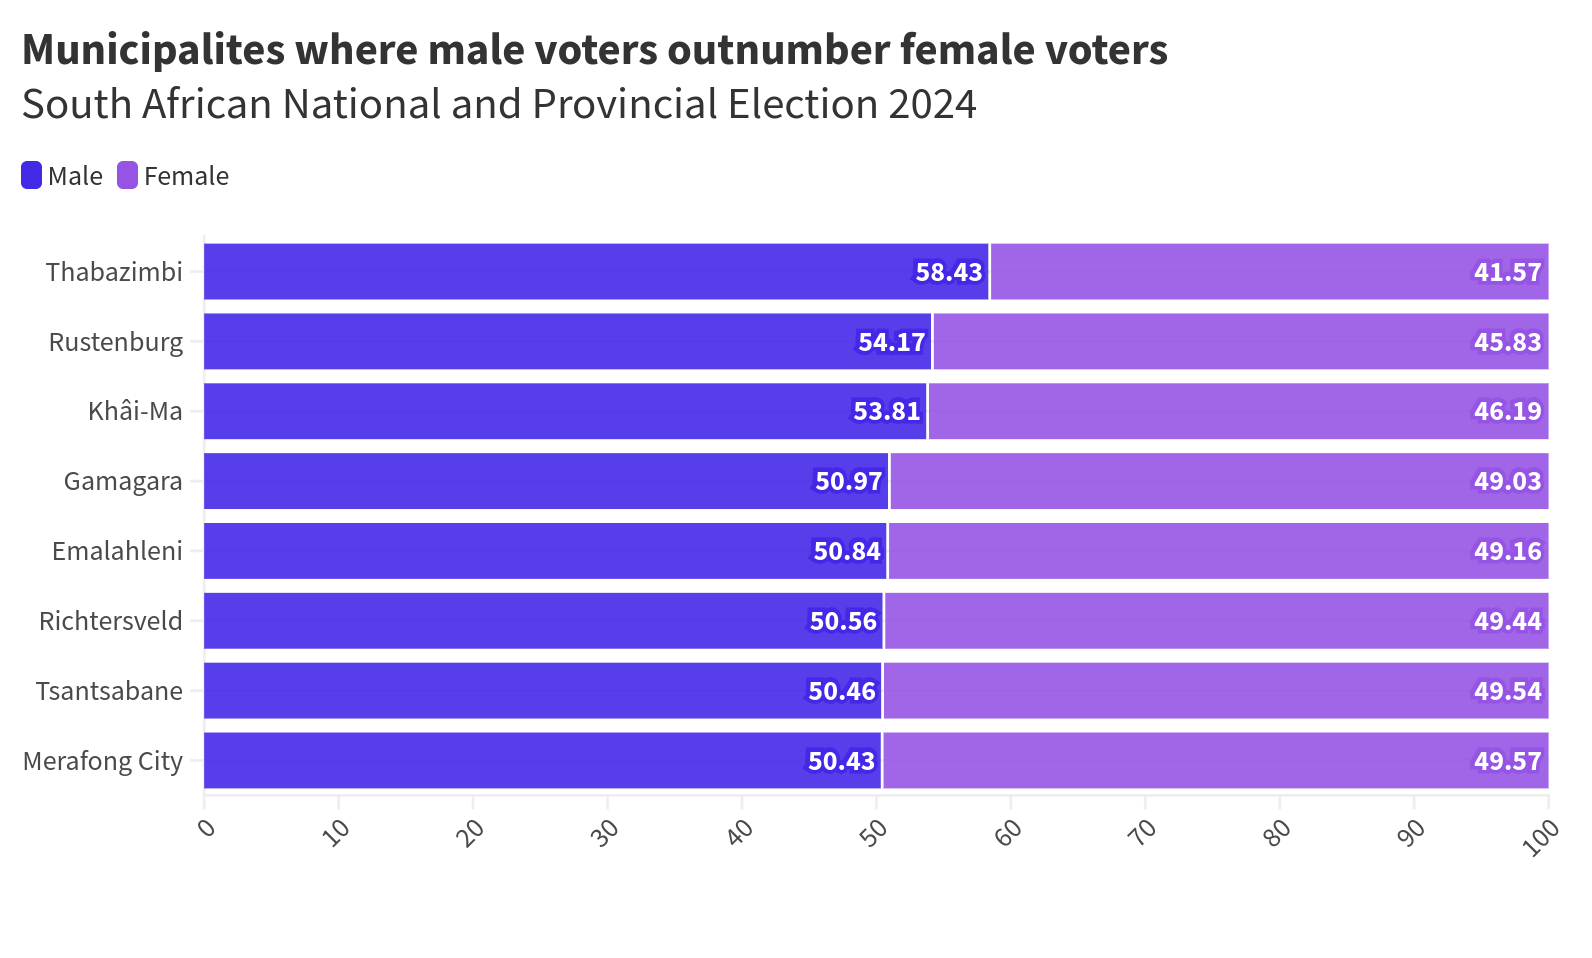
What does the gender and age disaggregated data reveal about voters in this election? Firstly, there are many more female voters than male voters in this election. In fact, there are only eight municipalities (out of 257) in which there are more men registered to vote than women, and half of those are in the Northern Cape.
Conversely, there are 12 municipalities in which more than 60% of registered voters are female. Six of these are in Limpopo, while five are in KwaZulu Natal. This data may be very useful in comparing the emergence of new parties at the provincial level. For example, MK is expected to poll well in KZN, but will it gain as much traction among women as among men?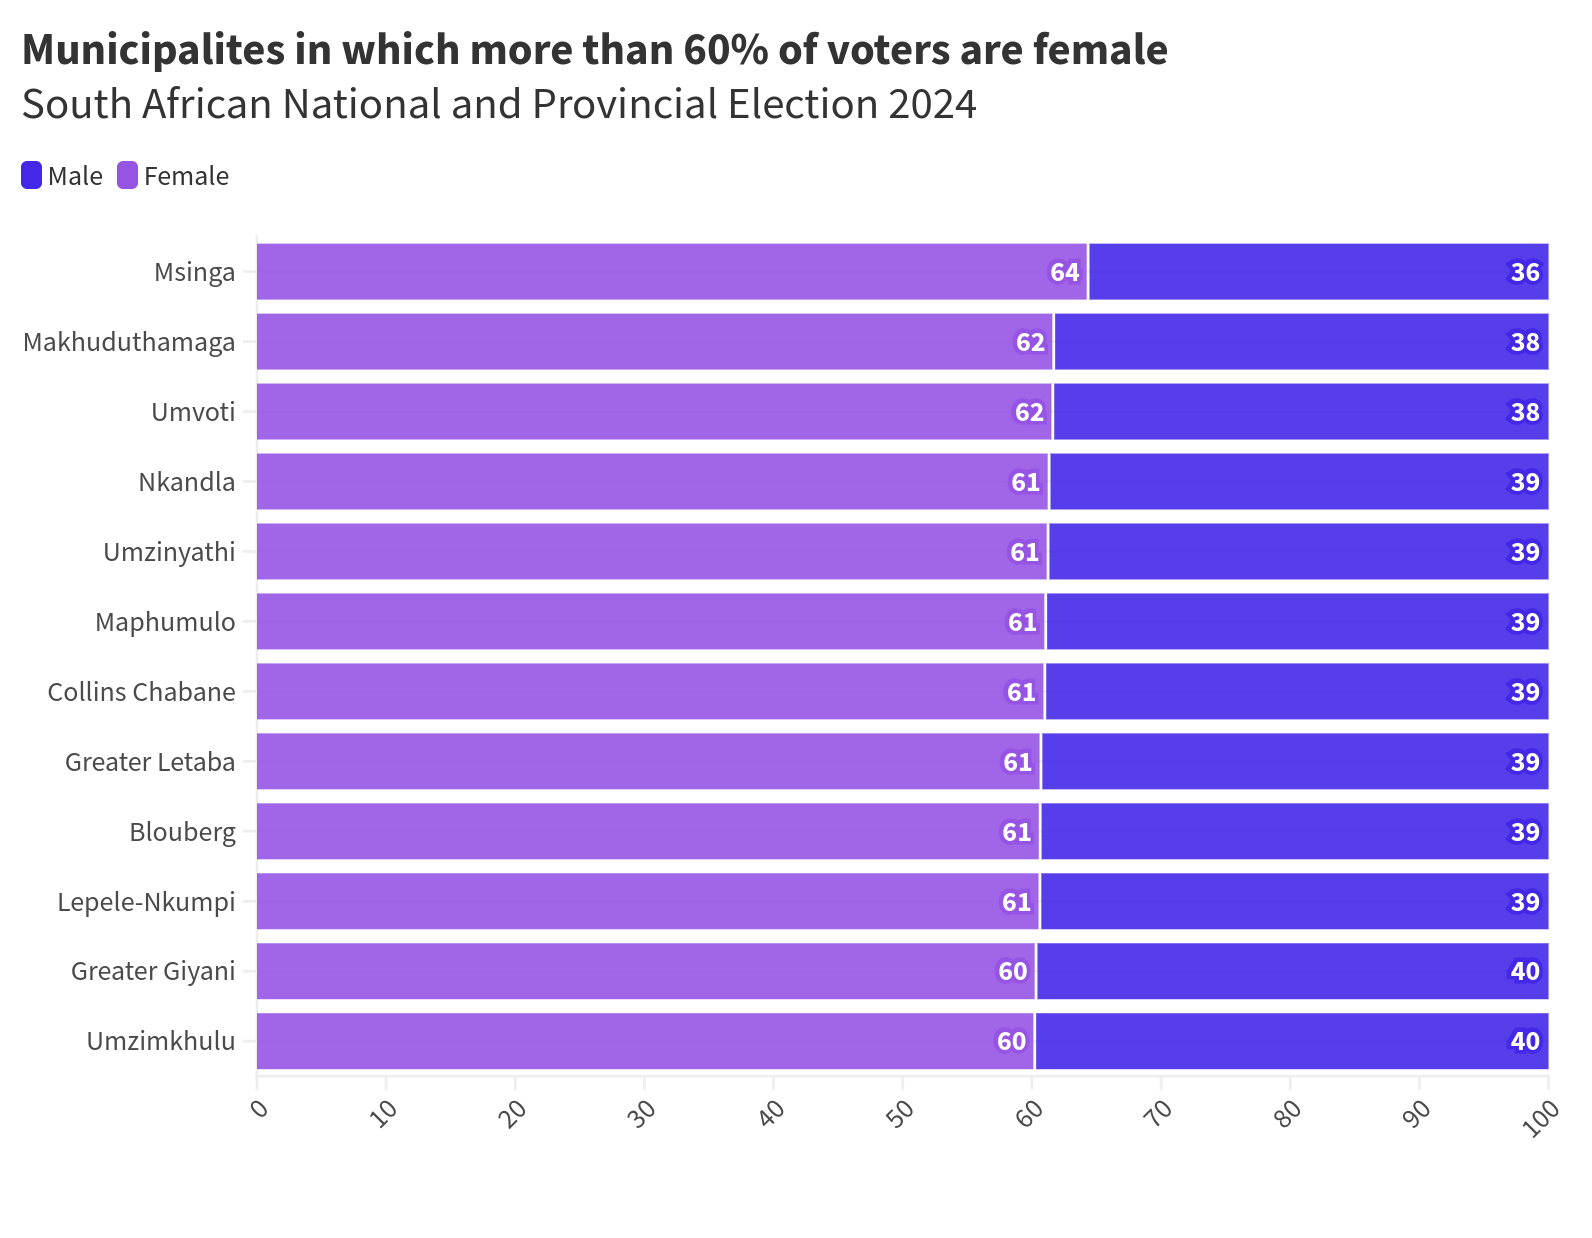 These points are important to bear in mind when thinking about coverage. Overwhelmingly, the voices that are heard in the media are male. Media Monitoring Africa reckons that about 88% of interviews relating to the elections feature men. This is not close to representative of the voting population.
The demographic bulge
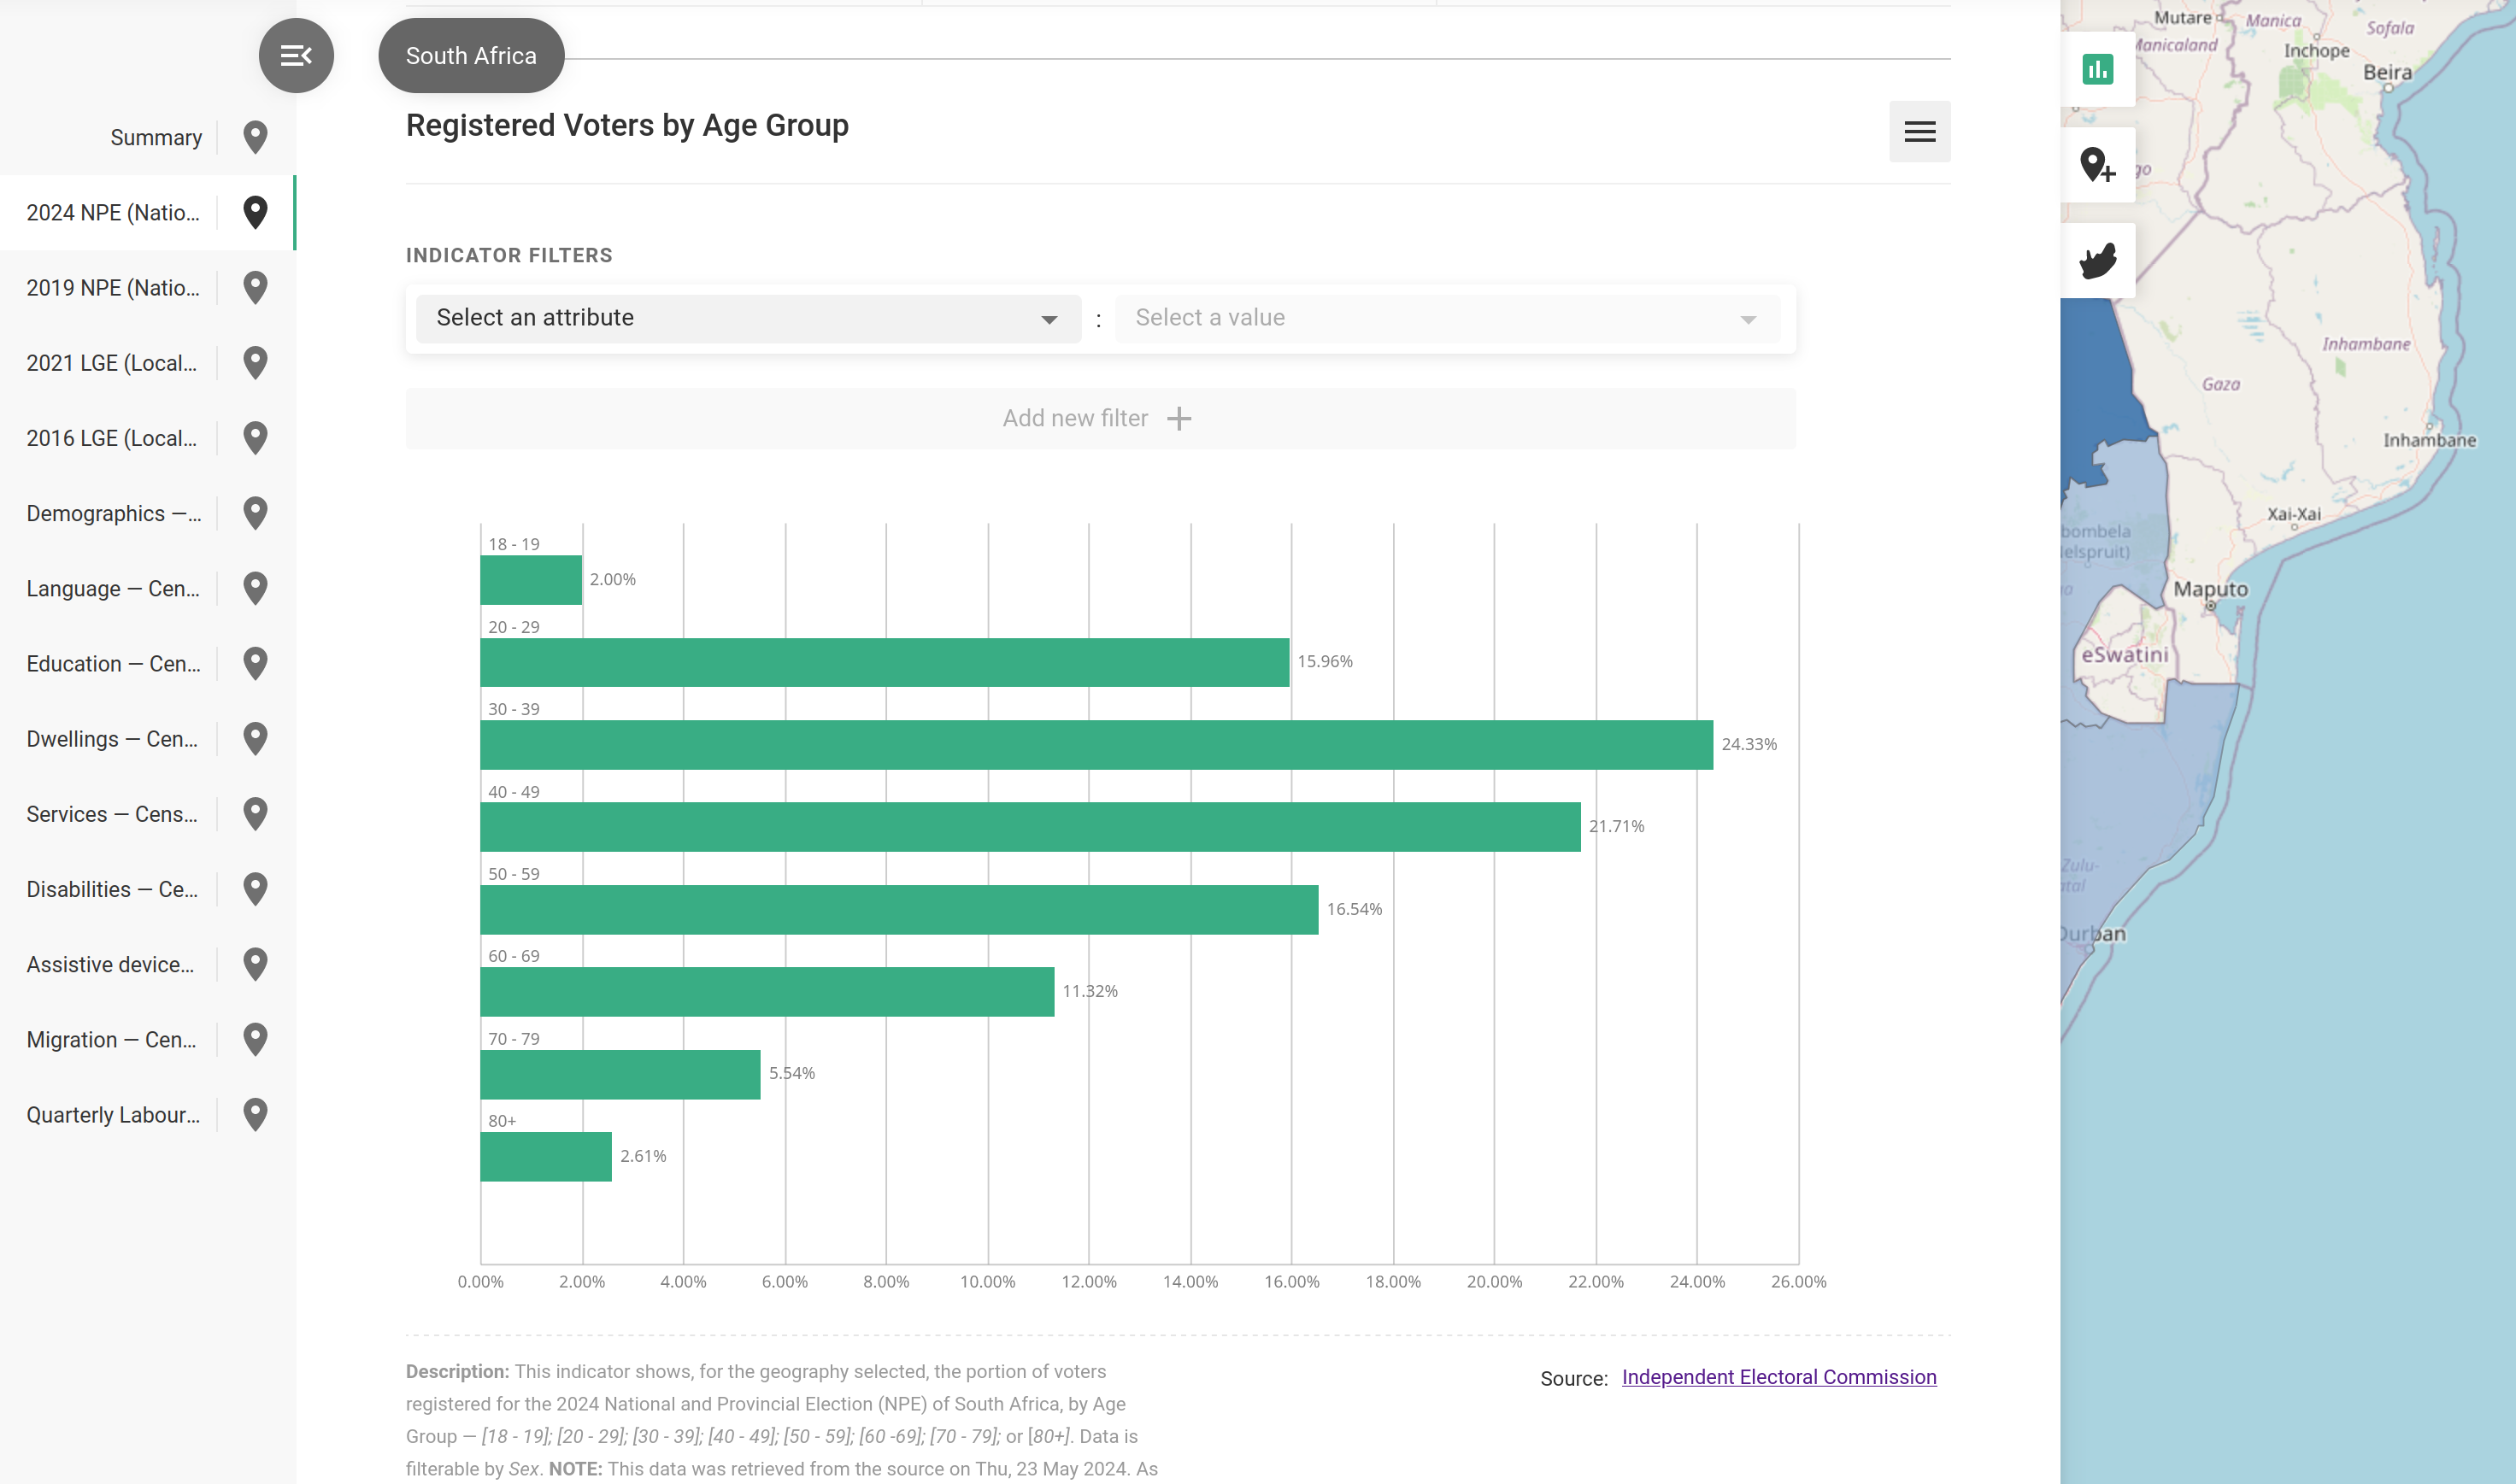
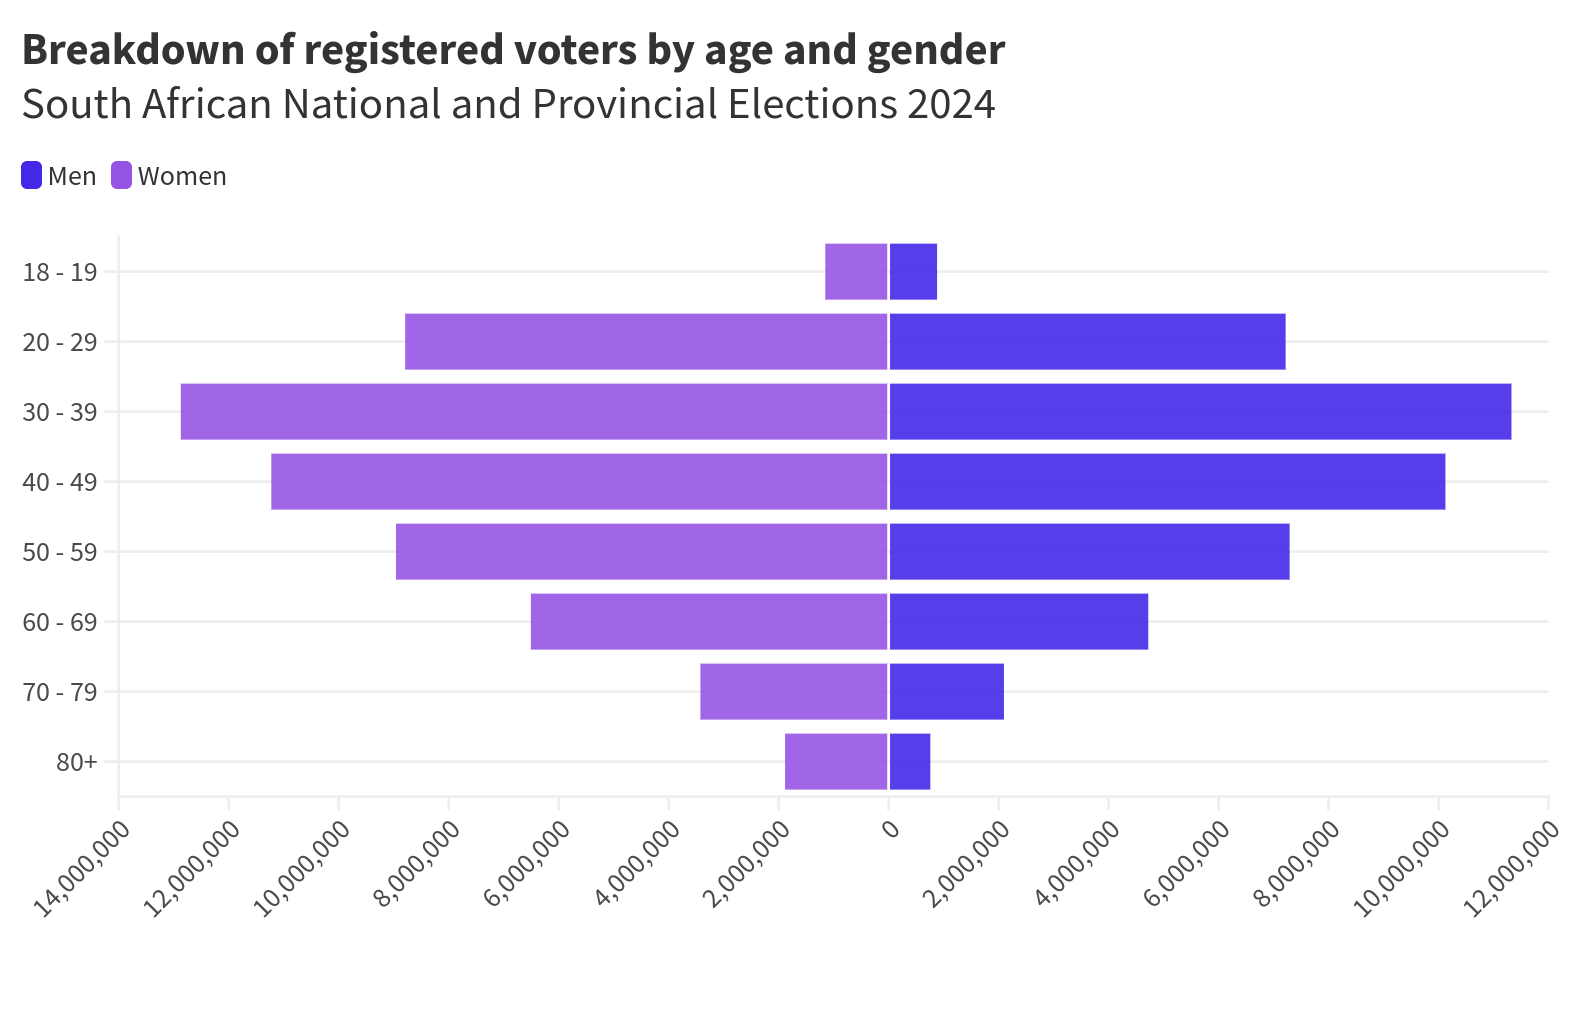
South Africa is a young population, but the demographic bulge isn’t as pronounced as it was. Some 43% of registered voters are younger than 40, while 64% are younger than 50. What is worth further investigation by journalists at the local level is the split between male and female voters by age. While there are a similar number of men and women between the ages of 40 and 49 registered (11 million women and 10 million men), more than 70% of voters over the age of 80 are women.
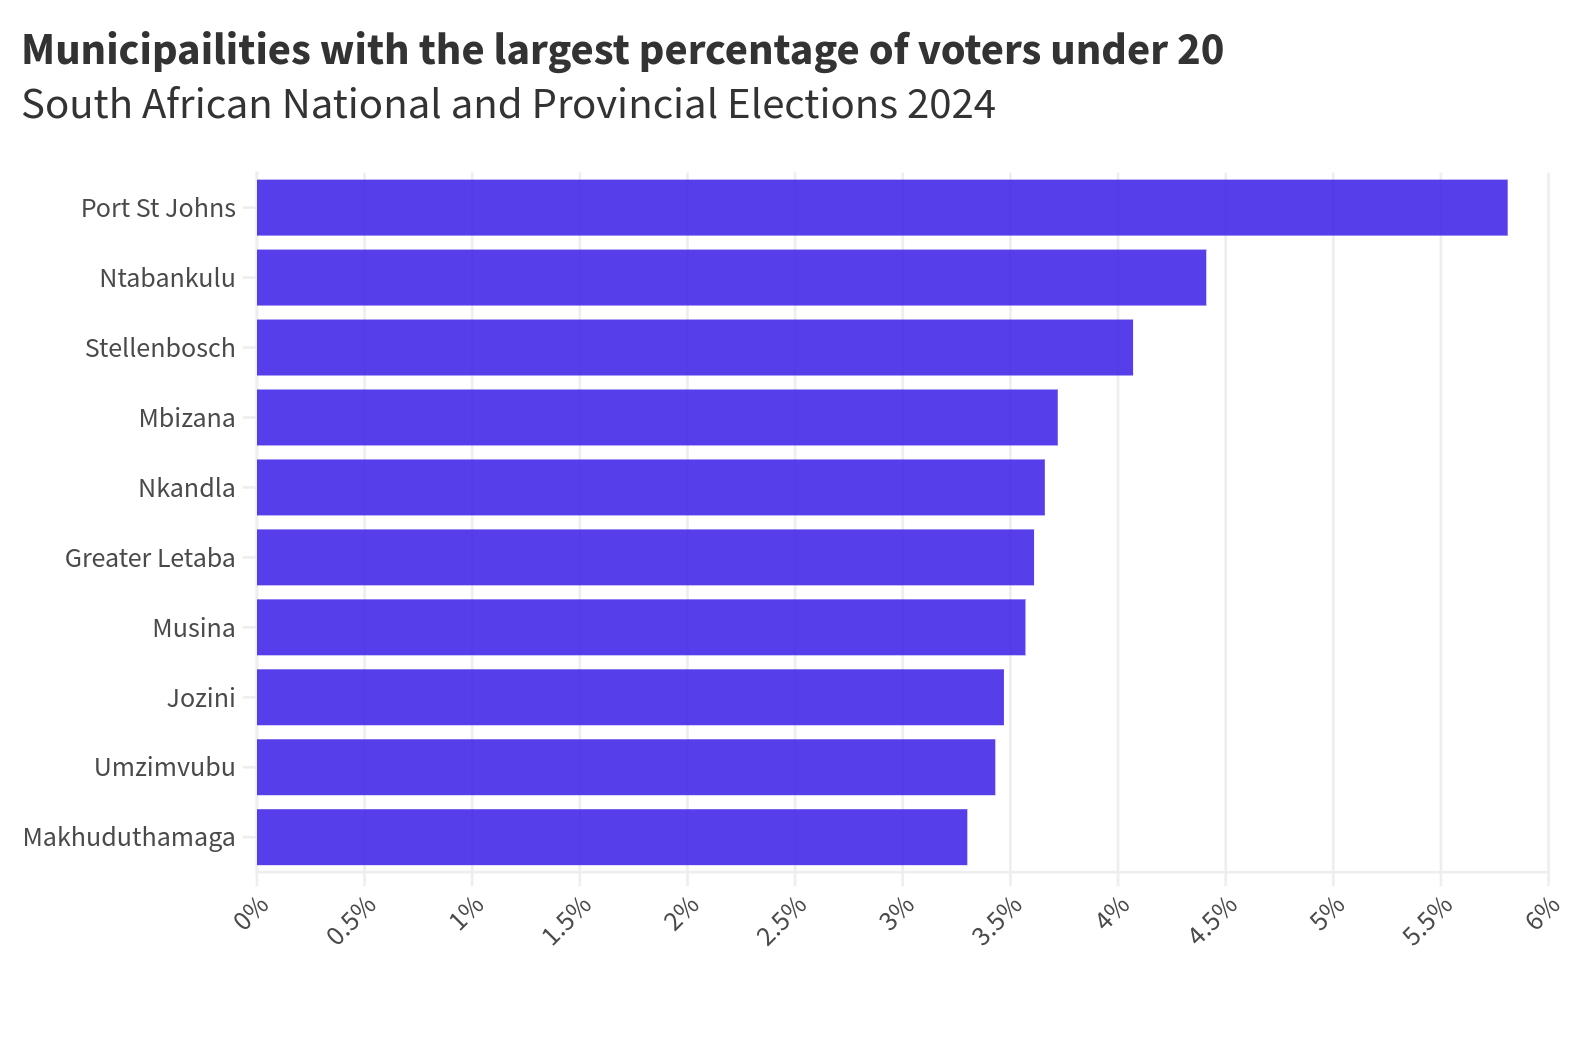
In this election, of course, all eyes are on the young. So which municipalities have the highest proportions of voters under the age of 20? Four of the top 10 are in the Eastern Cape (Port St Johns tops the list with 5%) and three are in Limpopo.
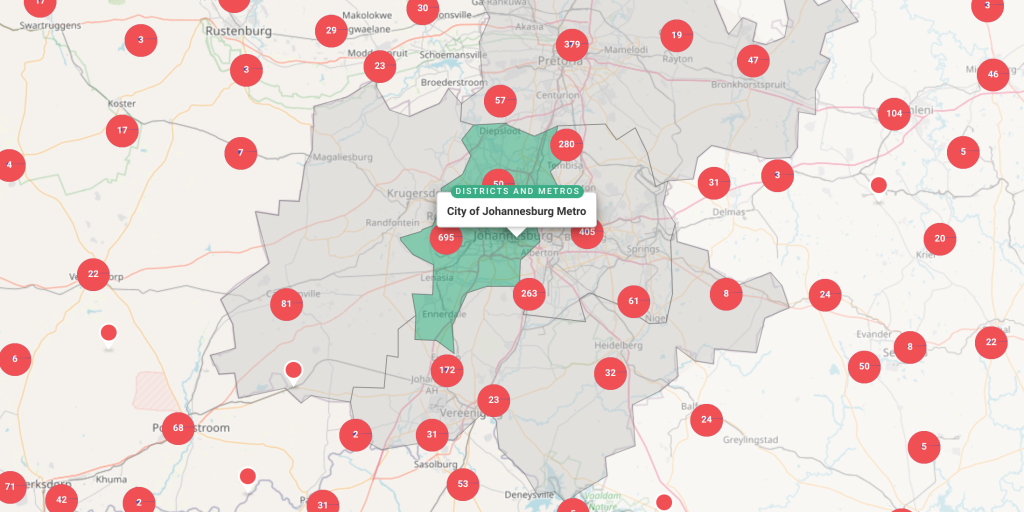
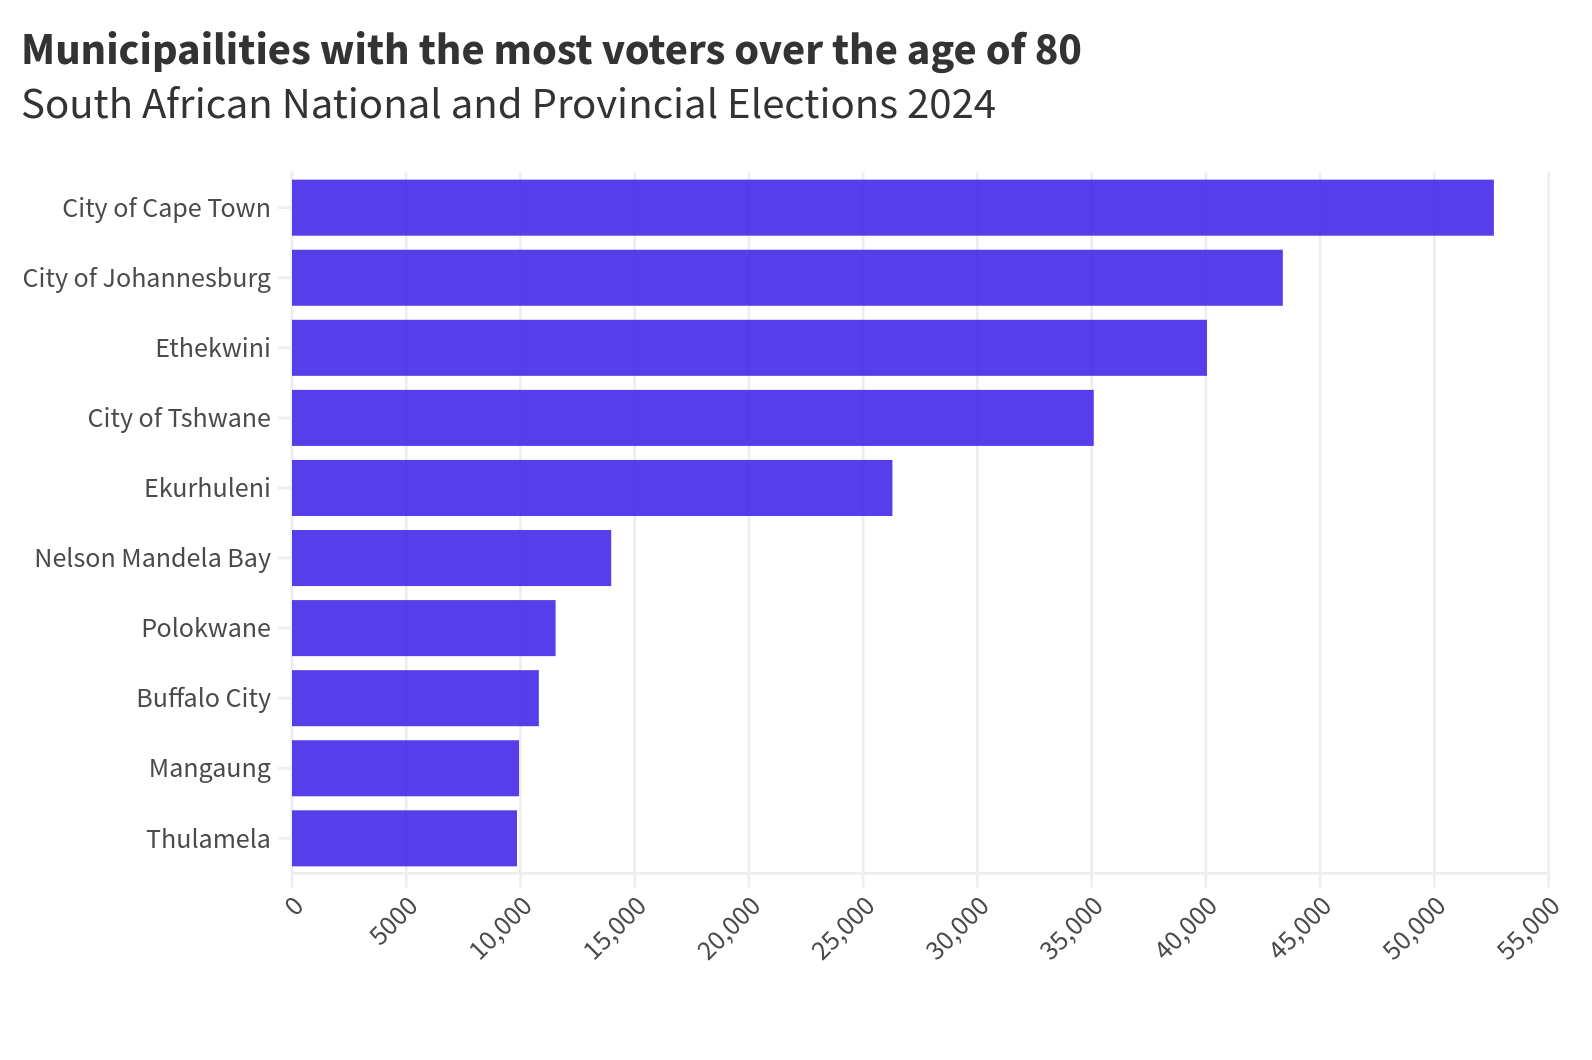
At the other end of the scale, Cape Town has the largest number of voters over the age of 80, followed by Johannesburg.
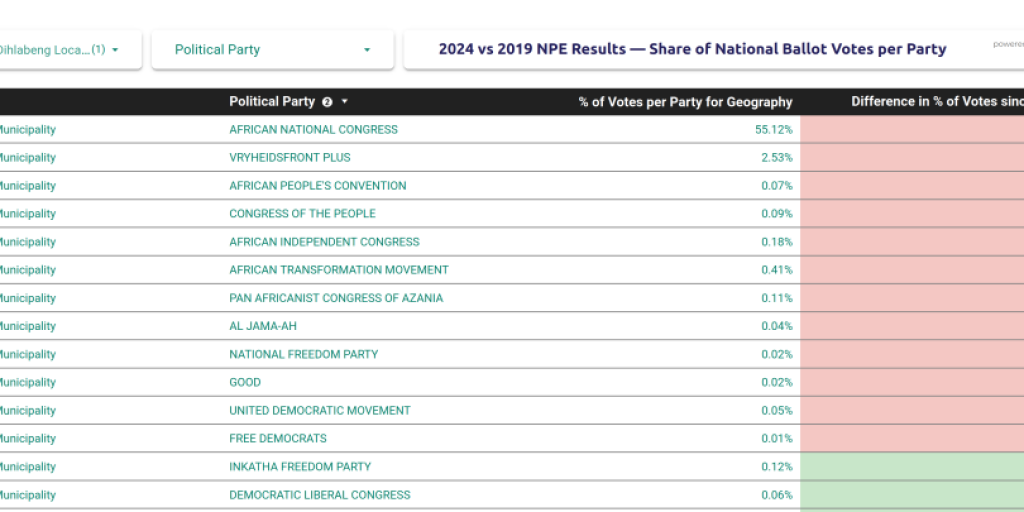
You can explore data around voter demographics for your local municipality in the SANEF Elections Dashboard here. Simply navigate either to the Data Mapper or Rich Data views to get accurate stats and comparisons for your area.
