ELECTIONS DASHBOARD
INTRODUCTION
THE SANEF ELECTION DASHBOARD
Accurate, reliable and accessible data for the 2024 general election, designed for journalist, academics and civil society. The SANEF Elections Dashboard provides up-to-date information on the current election, combined with historical data for national, provincial and local government elections over the last ten years.
The SANEF Elections Dashboard is an effective and responsive toolkit, which includes political, social, economic and demographic data from multiple sources at different levels of geographic aggregation. This includes, where possible, data specific to national, provincial, district, municipal and voting district regions.
Try it now using the link below.

HOW TO USE THE DASHBOARD
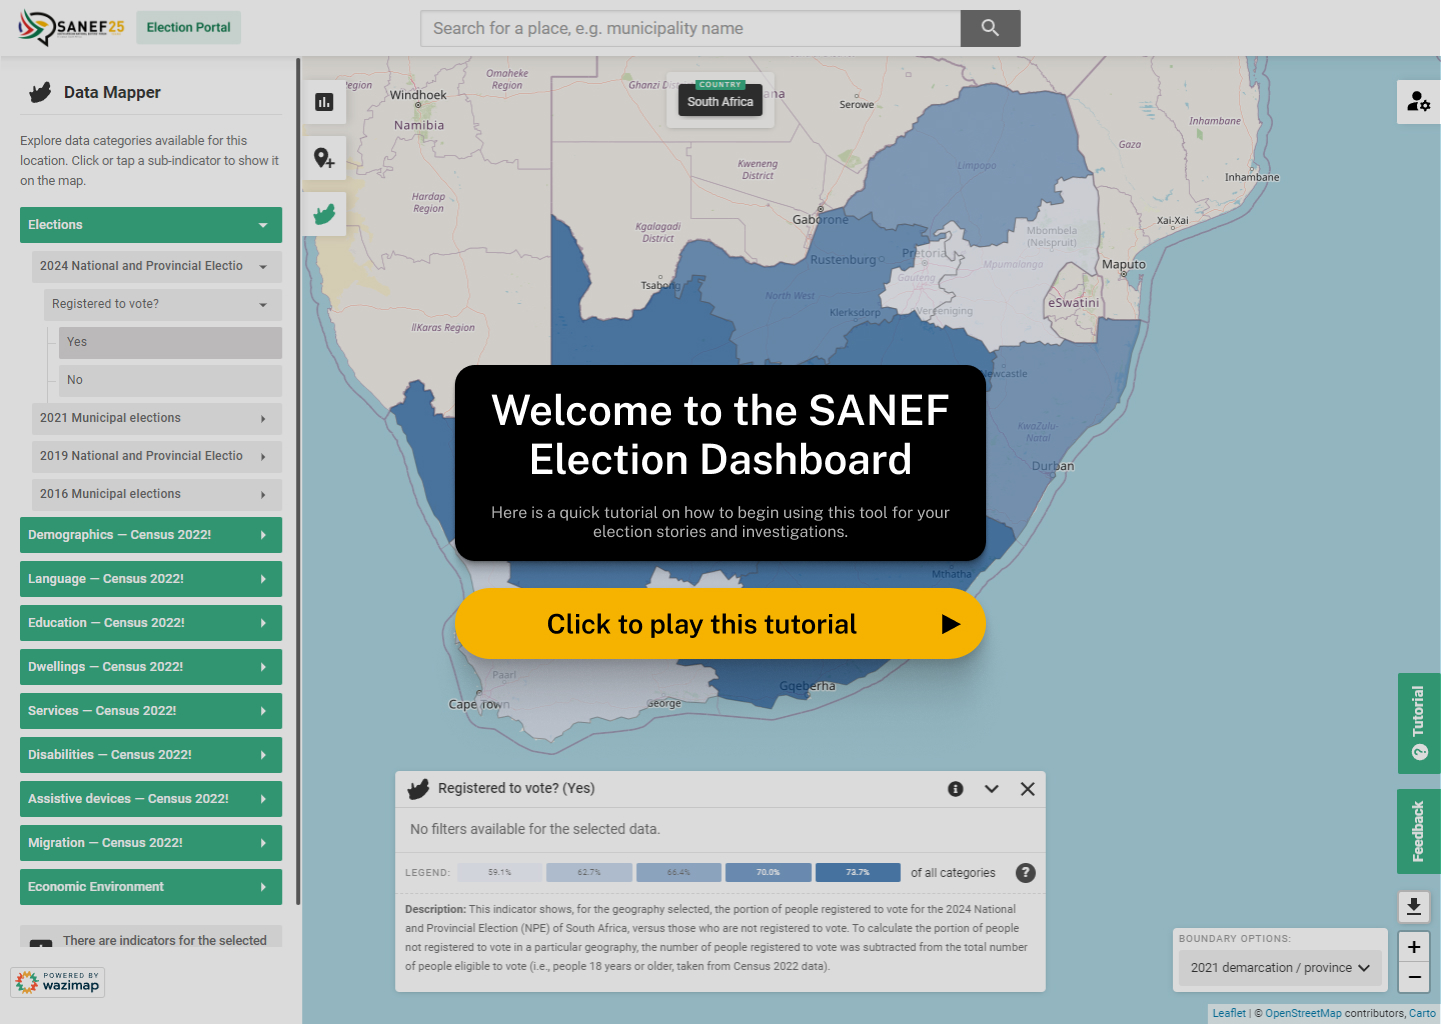
This animation may take time to load on first play.
BETTER STORYTELLING WITH ELECTION DATA


")

MORE ELECTIONS DATA

Whose Vote Counts?
Tracks political donations since 2021

Parliamentary Monitoring Group
Comprehensive records containing committee meeting data and bill progress

People’s Assembly
MP contact details, attendance and more

Municipal Money
Financial and social performance for your local council

Vulekamali
Explore national budgets from the Treasury

Media Monitoring Africa
Tracking election reporting, including misinformation/disinformation and xenophobic campaigning