How to compare election results with previous years in your area
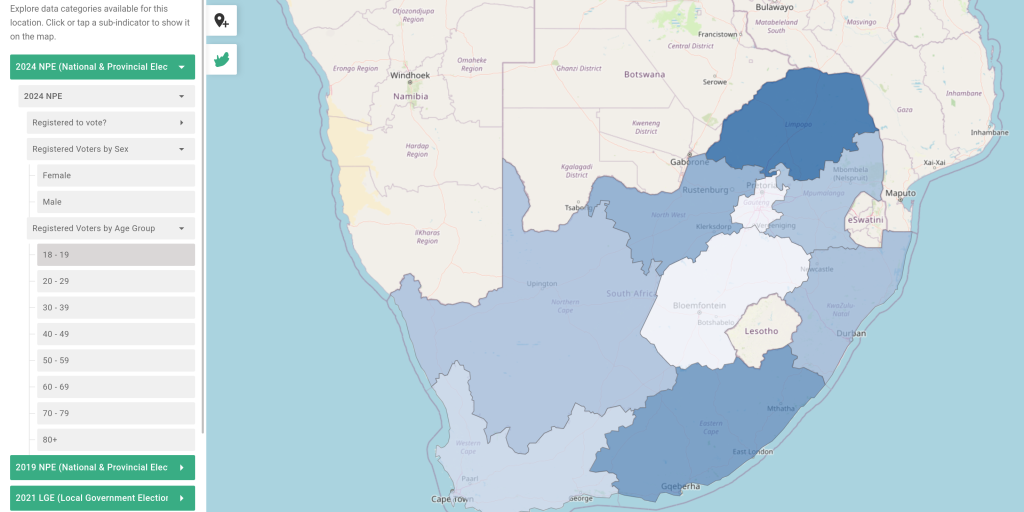
SANEF’s Election Dashboard is being updated with the latest results from the National and Provincial Election 2024, as they are made available by the IEC. You can now find the latest results at the national, provincial and voting district (ward) levels, under both the Data Mapper and Rich Data views. The number and proportion of votes counted is displayed by party name.
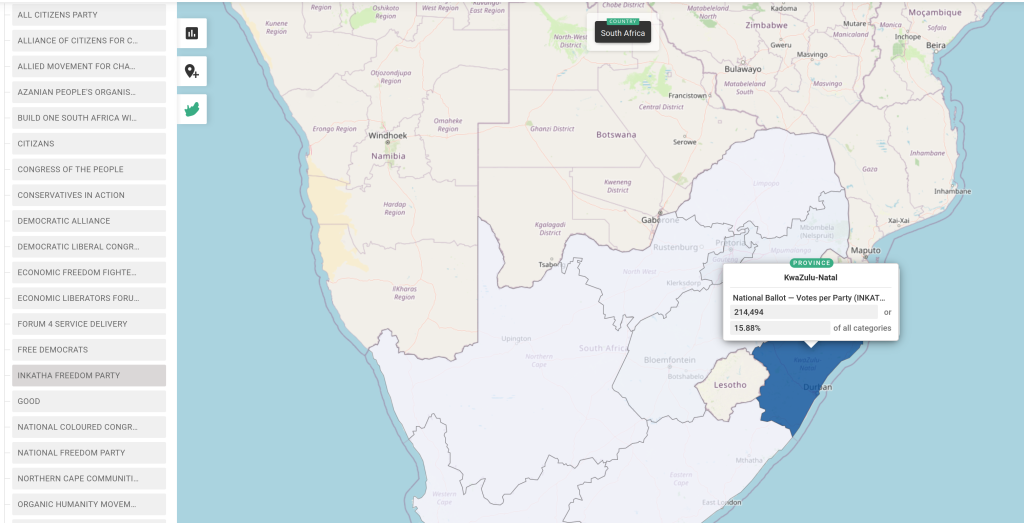
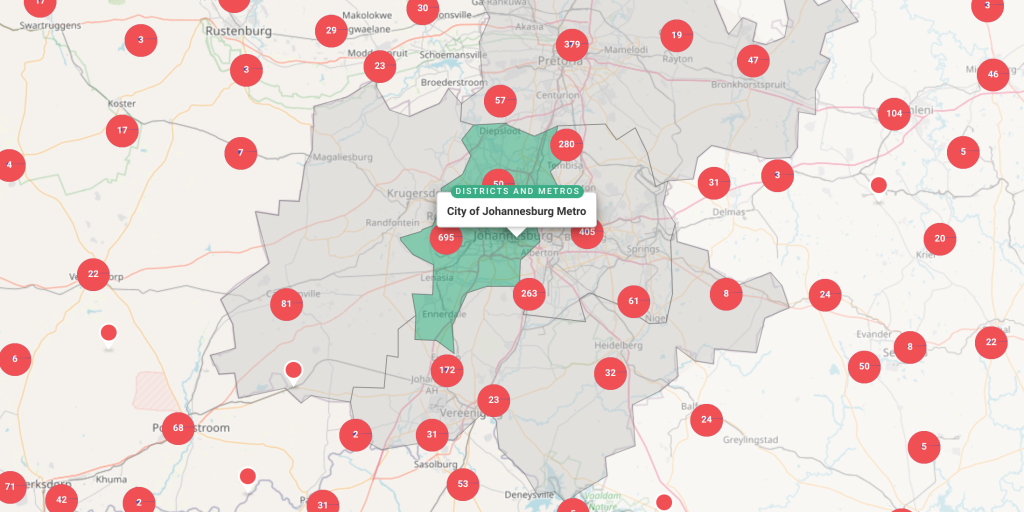
While the SANEF dashboard doesn’t directly show you which voting districts have declared by default, you can see this by zooming into the District and Metro view level, then selecting one of the major parties under Data Mapper>2024 National Elections>National Ballot. Areas that are coloured in (ie. show a percentage vote share) have declared. Areas that are blank have still not been counted.
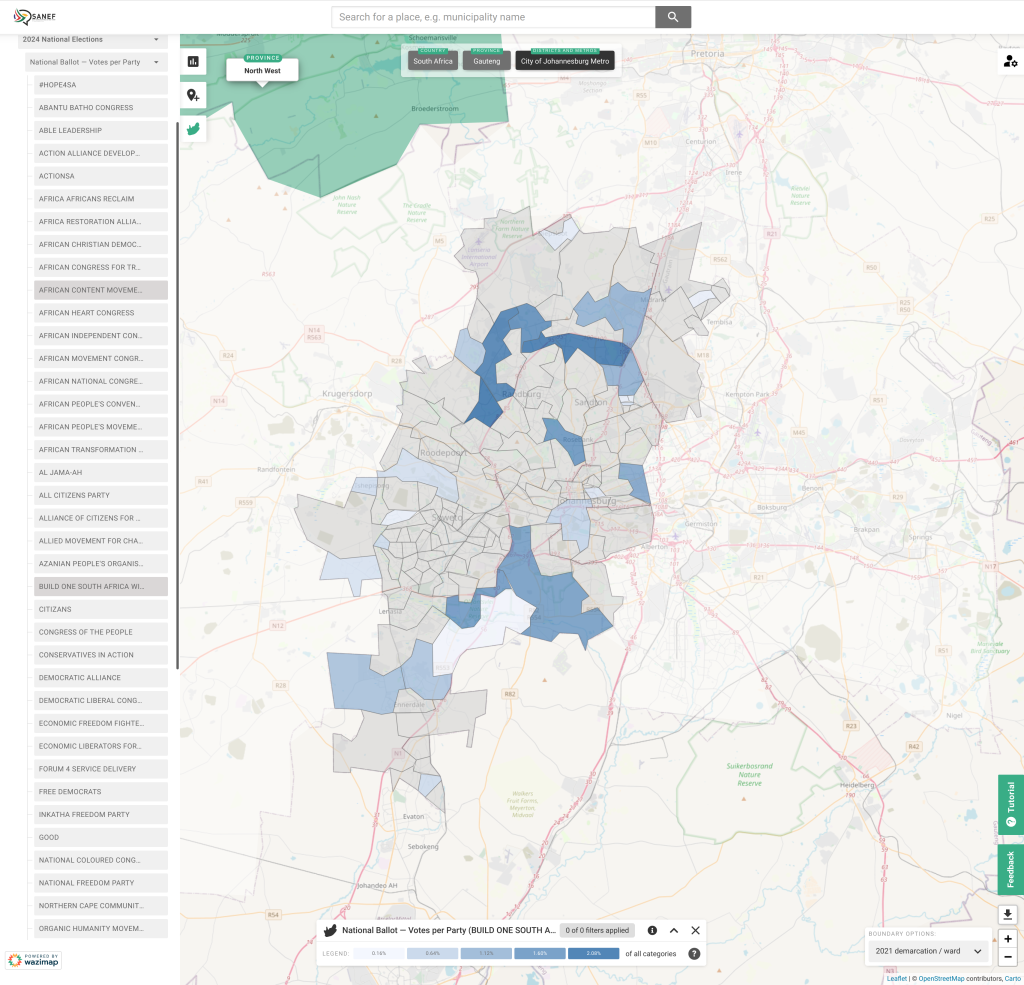
You can download data for a particular area using the Rich Data view and using the three line menu above the elections chart. We recommend saving the data as a CSV and creating your own chart in Flourish to display this data.

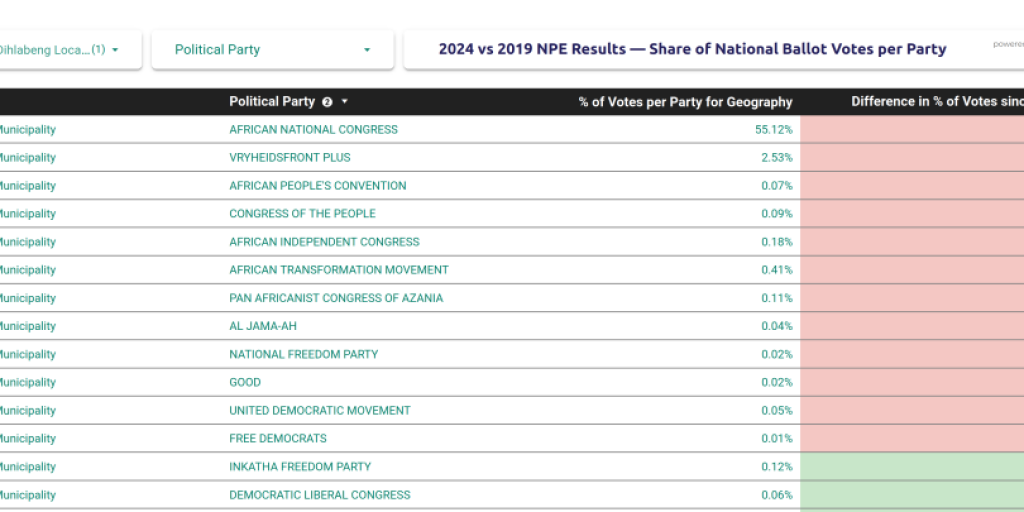
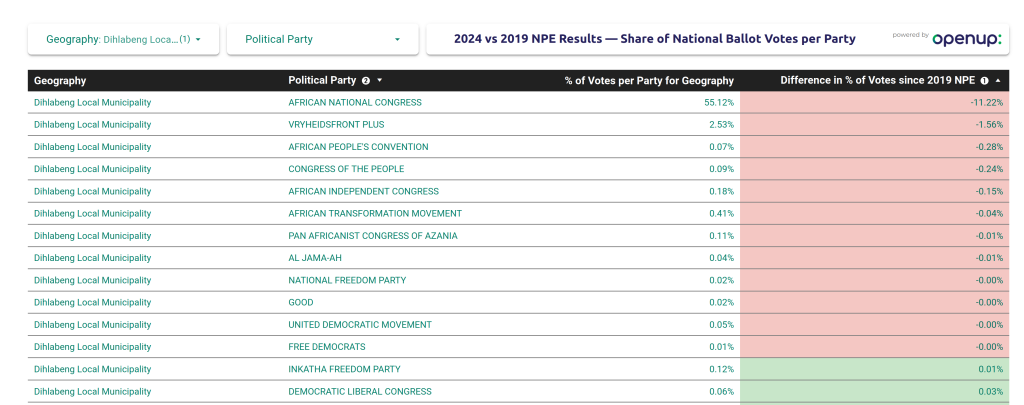
To help journalists who want to compare vote share per party in their local area, we’ve created a second dashboard that shows this data more clearly. You’ll find it here. Use the “Geography” filter to find the area that you are interested in, and you will see the percentage of votes cast for each party this year, and the change since 2019. Remember the 2019 data is also in the main SANEF Elections Dashboard if you want to cross reference it.
We’ll continue to update both dashboards over the next few days, with provincial results and seat counts as they are shared by the IEC.
